
Within the valuation of a special-use going-concern, there are generally two primary relevant metrics to examine: the Gross Profit Multiplier (GPM) and the Capitalization Rate. The former measures value by relating the sale price or value estimate to the gross profit generated by the property (or Sales Price divided by Gross Profit), while the latter relates value to the Net Operating Income (NOI) generated (or NOI divided by Sales Price). For the most part, the GPM-derived value indication will tend to be a more reliable and consistent indicator of value. The aim of this paper is to discuss why that is and what implications this has for appraisals and value multiples. Moreover, we aim to examine the broader trends driving valuation multiples in the California market.
Despite massive consolidation within the industry over the last couple years, as large regional/national operators and private equity funds move into the market, the majority of America’s gas stations/car washes tend to be occupied and run by small businessmen and women. In its 2015 State of the Industry Report, the National Association of Convenience Stores (NACS), an industry trade group, reported that there were approximately 154,195 c-stores/gas stations in the United States. Of these, 97,359 (63.14%) are operated by single-store operators, with a further 1,262 (0.82%) being operated by chains with 2-3 stores. In contrast, larger chains (100 stores and above) comprise only 23.25% of the market, accounting for 35,855 stores throughout the United States. The single-store operator is still a driving force in the industry.
Since the majority of these property-types are still run by small businessmen and women, operating expenses can vary dramatically from property to property. Some owners will consider every possible minor or tertiary expenditure as an operating expense, while others may want to show a more minimal expense burden for various reasons. NOI, of course, is a function of the reported operating expenses, meaning that said operating expenses will tend to influence capitalization rates dramatically. To illustrate this effect, we surveyed our database of California-located going-concern sales of gas stations. Approximately 177 sales were identified throughout California that have taken place since the beginning of 2002.

Most recently, the 66 identified sales taking place after 2013 show a wide variety in value metrics, with a range of 2.38 to 7.82 times gross profit and capitalization rates of 3.88% to 23.16%. The surveyed GPMs, though, exhibit a much narrower range and a lower coefficient of variation, with the GPM indicators having a coefficient of variation of 0.28, versus a wider coefficient of variation of 0.39 for the capitalization rate indicators. By eliminating the operating expense component from the data, the indicator becomes more consistent. The trend is reflected when examining past time periods, as well. By segmenting the sales data contained in our database into time periods reflecting stronger or weaker markets, the GPM remains a more consistent measurement. The sales surveyed between 2008 and 2012, corresponding to market conditions during the great recession, show a similar trend, with GPM indicators having a coefficient of variation of 0.30 versus 0.40 for the capitalization rate indications. Sales surveyed during the 2002 – 2007 time period show a similar trend.
Interestingly, the GPM indications tend to reflect market trends better than capitalization rates. Between 2002 and 2007, GPMs averaged 4.04, before declining to an average of 3.76 during 2008 – 2012. Currently, GPMs tend to average 4.12, near pre-recession figures. This experience reflects broader value trends, with gas station going-concern values having increased during the prior real estate bull market, declining during the recession, and then rebounding during the current recovery.
Average capitalization rates, meanwhile, show an opposite trend, with sales pre-recession showing capitalization rates of 12.65%, declining to an average of 10.69% during the recession, and then increasing to 11.61% in the current market, which would theoretically imply increasing values during the recession and falling values after the beginning of the recovery. This trend does not reflect actual valuations after the recession though, with cash flow generally increasing at most properties with increasing fuel margins, higher c-store sales, and recovered sales at ancillary profit centers such as car washes and quick serve restaurants (QSRs). A likely reason for this apparent anomaly is that profit dropped tremendously during the recession, while operational expenses didn’t fall nearly as quickly or as dramatically. Utilities didn’t fall much, nor did insurance costs. Certain repairs/maintenance expenses could be deferred but basic maintenance to keep in compliance with environmental regulations was still necessary despite market conditions. Labor behind the c-store counter is already low-skill and a wage floor is in place via federal, state, and local minimum wages. Real estate taxes could be challenged for re-assessment but the process took time and money. The effect was to see NOI slashed to a greater extent than gross profit on a percentage basis, as gross profit dropped but NOI effectively dropped more. Operating Expenses, as a percentage of gross profit, averaged 52.44% on an average gross profit of $545,388 between 2002 and 2007. Gross profit then declined to an average of $516,987 between 2008 and 2012, with operating expense ratios spiking to an average of 62.72%. Since 2013, these levels have normalized, with gross profit recovering to $672,810 and average expense ratios of 54.93%. Lower NOI resulted in lower overall capitalization rates. As a result, to look only at capitalization rate trends during this period would have been misleading. The market overall showed a decline in capitalization rates during a relatively tumultuous period when market values dropped. GPMs, however, mirrored the market more closely by eliminating the operational expense variable.
Focusing strictly on the post-recession sales (although this effect is mirrored in the other datasets), additional evidence of this effect is found by examining the direct relationship between sales prices and their respective indicators. Despite the ostensible additional precision of the value that should be attributable to a capitalization rate accounting for variances in operating expenses, the indicators based on gross profit actually have a higher R-Squared when predicting sales prices than the indicators based on NOI. The effect is demonstrated in the dual charts presented below, with the gross profit analysis yielding an R-Squared of 0.8242 and the NOI analysis yielding a lower R-Squared of 0.6574.
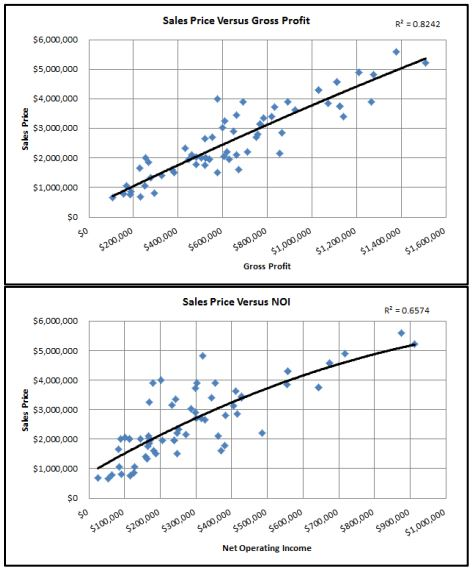
An additional interesting effect is revealed in this analysis, which becomes more pronounced in the NOI relationship but is nevertheless inherent in the gross profit relationship as well (both trend lines are second-order polynomials): As gross profit or net income increases, there is a point of diminishing returns that is reached, in which buyers will pay less for an additional dollar of income. Higher NOI generally results in increased risk to a buyer, with properties with above-average NOI generally commanding a higher capitalization rate than properties with near or below-market NOI. The effect is similar to an above-market leased fee interest, in which the landlord is collecting above-market rent from a tenant. A buyer is likely to use a higher discount rate to value that above-market rent that may be unlikely to continue into the foreseeable future. A potential buyer would logically be less willing to pay the same amount for a riskier income stream. Consequently, capitalization rates tend to get pushed upwards.
Moreover, properties with higher NOI will generally be higher-priced and will therefore have a smaller pool of buyers, which would also tend to push up capitalization rates. For properties with lower NOI, many more potential buyers can bid on the property, thus pushing capitalization rates into a lower and more constant range. Once properties become more profitable, the pool of buyers shrinks, flipping from a seller’s market to something of a balanced market or even a buyer’s market depending on the conditions. As a result, for gas station and car wash going-concerns, we tend to observe an inverse relationship between the NOI and capitalization rates paid.
The relationship for car washes is similar. The chart below shows the relationship between NOI and sales price for fourteen car wash sales in the southwestern United States that have taken place over the course of the last four years. Just as with gas station, it can be observed that as net operating income increases, sale price logically increases. However, as the NOI gets up to around $500,000 annually, the relationship begins to stagnate, with sale prices not increasing at the same prior rate. The gas station/cstore sales exhibit a similar inflection point in the $400,000 to $600,000 of NOI range. Furthermore, in the case of the car wash sales, the relationship becomes much more diffuse, with a wider variety of sales prices for generally similar NOI flows, although this may partially be a byproduct of a smaller dataset, as this effect appears to be much less pronounced with the gas station/c-store data.

Conclusion
Undoubtedly, both GPM and NOI analyses should be carried out in any appraisal of a gas station/c-store or car wash going-concern. They can both provide useful insight into how buyers, sellers, and other market participants value these property types, which can be quite complex. Differing locations, improvements configuration and condition, profit centers, underlying land values, and a multitude of other factors can influence values. These two relationships cut to the heart of the matter. However, value indications arrived at via GPMs will tend to be more consistent because of the more consistent market data available. Due to the nature of accounting for operational expenses within small business structures, capitalization rates will tend to be somewhat less reliable and are generally considered to be supporting indicators.
Questions/ Comments?
[email protected]
Seeking an Appraisal?
[email protected]
2 comments
Estela
I really love your site.. Very nice colors & theme.
Did you develop this site yourself? Please reply back as I’m planning to create my own site
and would like to know where you got this
from or what the theme is called. Kudos!
Retail Petroleum
Good Morning Estela,
We developed the site on our own using WordPress! Thank you for your kind words.